There are no clear rules on where, how and what company data is collected and who can use it to make decisions. However, proper business data analytics greatly improves reporting and structured data collection. In this post, we will look at the most important strategies and implications for decision-making in business data analytics and structuring in enterprises.
What should you keep in mind when using business data analytics?
The more structured the data is, the better it can be analysed. What is data structuring:
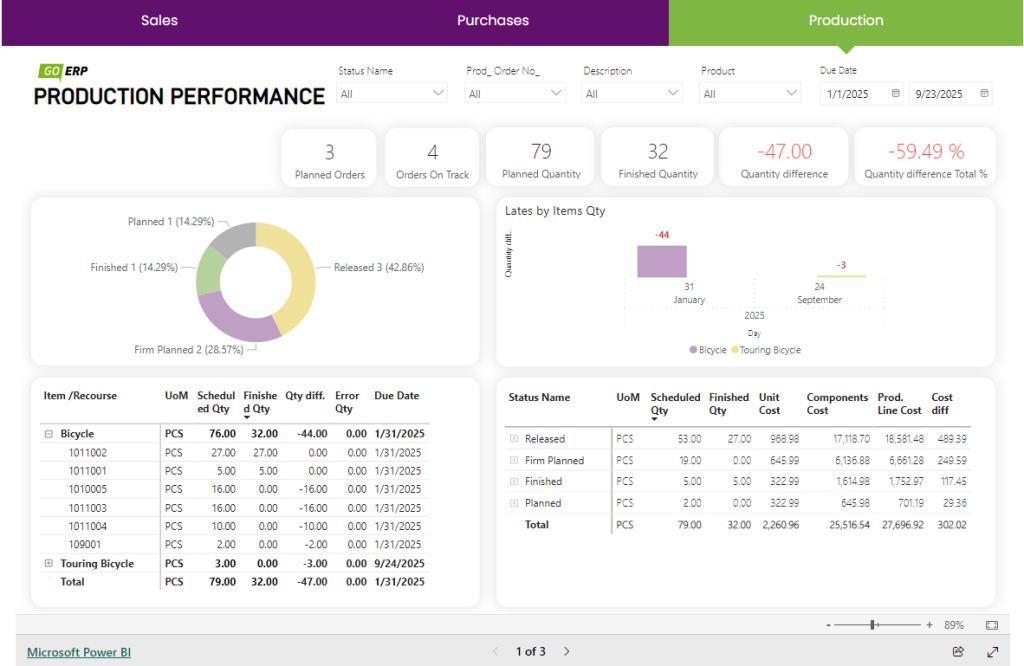
- Dimensions in the Business Management System will allow you to “slice and dice” the data according to the desired sections. Don’t overload your business management system with reports, get the attributes you need and analyse Microsoft Power BI business data analytics tool.
- The split fields in the system will allow faster filtering of the desired cut. Don’t write text in one field that will prevent you from finding information later. For example, a separated city field, street field will be more quickly and conveniently available in analytics without additional programming.
- When designing new functionalities, include additional features that can help you with business data analytics. For example, you have different types of projects. To identify what type of project it is, filter the data by project type and find it in a business data analytics application.
Systematic data collection
Not all staff have a clear understanding of the meaning of key business data analytics and avoid filling in the necessary fields in the system. Staff may decide not to enter information into the system.
- Make the most important fields mandatory to see the overall picture of the business data.
- Explain to staff the importance of information capture, what business decisions it can help them make and how it will improve decision-making.
- Think about what data will help you calculate KPIs, metrics. You might want to see how many sales are generated when one colleague brings a customer to another colleague. You won’t see this if you don’t have the option to mark cross-selling.
Different sources of business data
- Combine business performance data from different sources into a single Power BI report. This can be information from different countries, information in different formats (SQL DB, Excel, web site, etc.). Power BI will allow you to collect and structure your data.
- Carefully create names for your data. If you have different names for the same data, this will make it more difficult to produce analytics due to possible duplication of information.
The importance of analytics culture
- Never rename old system fields, always create a new field, thus preserving the history of the field. If you change the name of a field, all the information will be tied to the new field and you will make it very difficult to analyse if you think that the field had a different meaning before x date.
- Create a culture based on analytics in your company. We often speak in emotions, but what do the numbers say?
Want to get to grips with advanced Power BI business data analytics? Please contact us at. email v.kudirkiene@go-erp.eu, we will call you to schedule a remote meeting, which will cost you nothing but will help you plan possible paths for the development of the analytics.
You can also try Power BI reports here: